描述
")
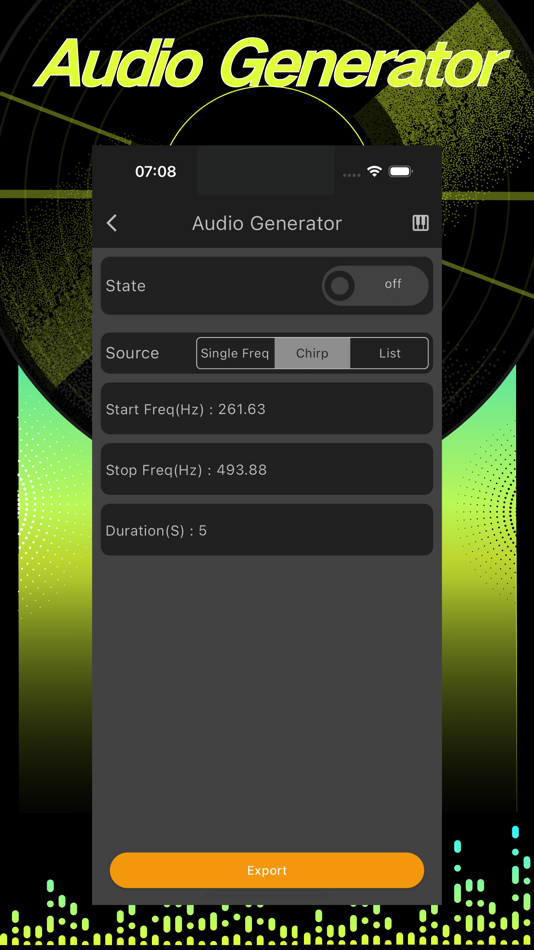
Supports a variety of measurement modes such as spectrum analysis, phase spectrum analysis, audio oscilloscope, persistence spectrum, power distribution, spectrogram, etc.
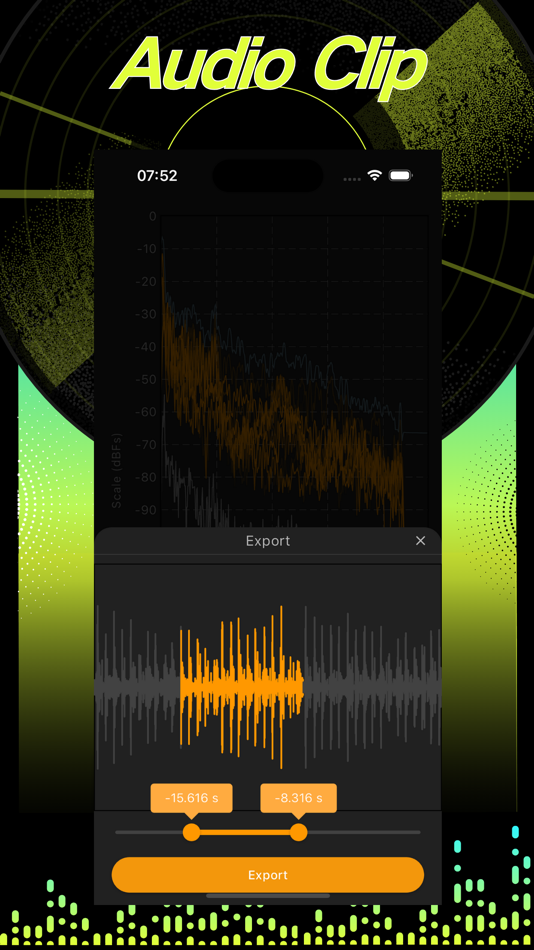
Supports accessibility functions such as audio recording, audio playback, audio clipping, peak measurement, and more.
【Spectrum Analysis】
The frequency audio spectrum is a description of how an audio signal behaves in the frequency domain. An audio signal is represented in the time domain as a change in volume over a period of time, while a spectrogram shows how high or low the volume of this audio is at each frequency at a certain time.
The software supports custom spectrum measurements and flexible definition of frequency ranges. A variety of trace options to assist in peak measurement.
【Audio Oscilloscope】
The oscilloscope measurement is different from the spectrum measurement, which reflects the frequency domain information of the audio signal, and the oscilloscope reflects the time domain information of the audio signal.
An oscilloscope converts an electrical signal into an image, allowing the user to judge the characteristics and waveform of the signal by looking at the image. This is very helpful for observing the signal waveform in the circuit, and can clearly see the waveform, frequency, amplitude and other characteristics of the signal, so as to judge the quality and performance of the signal.
【Power Distribution】
The power distribution measurement is similar to the spectrum measurement, both of which display the frequency domain power value of the signal, but the difference is that the power distribution measures the integrated power of the signal within a certain bandwidth with a certain point as the center frequency. Functions such as maximum and minimum value holding are supported.
【Persistence Spectrum】
The afterglow spectrum is an extension of the spectrum measurement, and the afterglow spectrum also shows the frequency domain characteristics of the signal. This measurement is based on the spectrum measurement, adding multiple trace displays, the latest trace uses the maximum brightness, and then fades over time, so the afterglow spectrum is a powerful tool for observing the change direction of the signal at the same time.
【Spectrogram】
A spectrogram is a graphical representation of a sound signal in time and frequency. Spectra provide a visual representation of the spectral characteristics of a speech signal over time. Through the spectrogram, we can observe the frequency and time characteristics of the sound signal, and thus gain a deeper understanding of the nature of the sound signal. At any given moment, a spectral diagram can show the intensity of different frequency components, which is usually represented by the grayscale of the corresponding point or the intensity of the hue. This dynamic spectral representation helps us capture the complex properties of sound signals that change over time.
【Paid Membership Features】
- Frequency range customization
- Data record limit increased
- Unlock audio clips
- Unlock advanced configurations
【Activate Paid Membership】
Paid members are available as a subscription or as a permanent activation
Membership Service Agreement: https://audioanalyzer-serviceagreement.mysxl.cn/
螢幕擷取畫面


價錢
-
* 應用內購買 - 今天: 免費
- 最小值: 免費
- 最大值: 免費
追蹤票價
開發人員
- 嘉欣 胡
- 平台: macOS 應用程式 (6)
- 清單: 1 + 0
- 點數: 14 + 3 ¡
- 排名: 0
- 評測: 0
- 折扣: 0
- 影片: 0
- RSS: 訂閱
點數
-

- 10,307 Simon Chan
- +1
-
- 41 Mick1234
- +1
-
- 105 윤대남
- +1


排名
0 ☹️
清單
評測
成為第一個評論 🌟
其他資訊
- 🌟 分享
- Mac App Store
你可能還喜歡
-
- Dipper - Audio Capture
- macOS 應用程式: 公用程式與工具 由: Existential Audio
- * 免費
- 清單: 0 + 1 排名: 0 評測: 0
- 點數: 6 + 0 版本: 1.12 Introducing Dipper, the ultimate audio capture companion for your Mac. With its powerful capabilities, Dipper revolutionizes the way you effortlessly capture and manipulate audio from ... ⥯
-
- Audio Viewer
- macOS 應用程式: 公用程式與工具 由: Hideaki Tsukioka
- $0.99
- 清單: 0 + 0 排名: 0 評測: 0
- 點數: 1 + 0 版本: 1.3 This app displays the waveform of audio files. It can quickly display the waveform of a large file size over 1GB. ⥯
-
- Audio Logger
- macOS 應用程式: 公用程式與工具 由: Pavel Aristov
- $5.99
- 清單: 0 + 0 排名: 0 評測: 0
- 點數: 1 + 0 版本: 2.0.1 This program is designed for archiving of audio content, e.g. live radio broadcasts, to AAC, MP3, WAV or Apple Lossless files. As a source, you can use a microphone or any sound card ... ⥯
-
- Audio Book
- macOS 應用程式: 公用程式與工具 由: 栋 陈
- * 免費
- 清單: 1 + 0 排名: 0 評測: 0
- 點數: 14 + 0 版本: 1.9.8 Audio Book is a powerful and practical macOS Text-to-Speech, Document-to-Audio application, which enables you to convert text content and various types of document file to audio ... ⥯
-
- Audio Profile Manager
- macOS 應用程式: 公用程式與工具 由: Septimal Mind Limited
- $4.99
- 清單: 0 + 0 排名: 0 評測: 0
- 點數: 0 + 0 版本: 1.1.7.18 Audio Profile Manager allows you to lock default input and output audio devices so it will be impossible for other apps to switch your microphone and speaker. Also, it allows you to ... ⥯
- -100%
- Audio Transcribe Pro
- macOS 應用程式: 公用程式與工具 由: Emanuele Floris
- ▼ * 免費
$24.99-100% - 清單: 1 + 0 排名: 0 評測: 0
- 點數: 2 + 0 版本: 2.1 Tired of spending hours transcribing interviews, lectures, or voice notes? This app transforms your Mac into a powerful transcription studio. Stop hitting 'pause' and 'play' hundreds ... ⥯
-
- Audio file and text conversion
- macOS 應用程式: 公用程式與工具 由: xiao dong zhou
- 免費
- 清單: 1 + 0 排名: 0 評測: 0
- 點數: 2 + 0 版本: 1.0.0 Features * Convert audio files to text. * Convert text to audio, and can export to audio file. Audio file support formats: aac, aif, aifc, aiff, caf, mp3, m4a, wav Export to audio file ⥯
-
- Audio Lock
- macOS 應用程式: 公用程式與工具 由: Elena Kryvytska
- $0.99
- 清單: 0 + 1 排名: 0 評測: 0
- 點數: 0 + 0 版本: 1.0 Small but very powerful application for saving your audio input/output. How much time you have connect you new audio device to macOS and system automatically choose new input/output ... ⥯
-
- Mic Audio Level
- macOS 應用程式: 公用程式與工具 由: Clement Rousseau
- $3.99
- 清單: 0 + 0 排名: 0 評測: 0
- 點數: 1 + 0 版本: 1.10 Mic Audio Level is a simple sound level meter app that helps you monitor your microphone's audio levels directly from your Mac's menu bar. Whether you're recording a podcast, ... ⥯
-
- Instant Audio Switcher
- macOS 應用程式: 公用程式與工具 由: Jedidiah Fox
- 免費
- 清單: 0 + 0 排名: 0 評測: 0
- 點數: 2 + 0 版本: 1.5 The volume menu on macOS Big Sur allows you to change which device receives audio output. However, that takes a few clicks. This simple app gives you the ability to switch to a ... ⥯
-
- Final Audio Record
- macOS 應用程式: 公用程式與工具 由: 华芳 刘
- $1.99
- 清單: 0 + 0 排名: 0 評測: 0
- 點數: 0 + 0 版本: 2.1 Final Audio Record is a simple and user-friendly audio record software. * Support all kinds of audio input devices, such as Built-in、Microphone、Usb、Serial audio input device, etc. * ... ⥯
-
- Muzz - Audio Spectrum Analyzer
- macOS 應用程式: 公用程式與工具 由: Amit Nadir
- $5.99
- 清單: 0 + 0 排名: 0 評測: 0
- 點數: 0 + 2 (1.0) 版本: 1.0.6 The purpose of Muzz is to help audio technicians, beginners and experts, to analyze any audio signal and to understand the characteristics of the spectrum fundamental, harmonics, ... ⥯
-
- MagicGlance Audio
- macOS 應用程式: 公用程式與工具 由: Ori Roniger
- $1.99
- 清單: 0 + 0 排名: 0 評測: 0
- 點數: 0 + 0 版本: 1.11 Never be caught off guard by low battery again with our cutting-edge Battery Indicator Application for Mac headsets. Say goodbye to unexpected interruptions and embrace uninterrupted ... ⥯
-
- Computer+Mic Audio Recorder
- macOS 應用程式: 公用程式與工具 由: Gustav Terkelsen
- $3.99
- 清單: 0 + 0 排名: 0 評測: 0
- 點數: 1 + 0 版本: 1.0 This app will allow you to record both the internal computer audio as well as your microphone. Use it to record Skype talks, the sound from Teams meetings, sound for your podcast and ... ⥯