| Разработчик: | KYBERVISION JAPAN LLC (3) | ||
| Цена: | Бесплатно | ||
| Рейтинги: | 0 | ||
| Отзывы: | 0 Написать отзыв | ||
| Списки: | 0 + 0 | ||
| Очки: | 0 + 3 ¡ | ||
| Очки + 1 | |||
Описание
")
"Math Graphing" can help students improve their math skills by developing some visual intuition of mathematical expressions or advanced users who need some scientific capabilities only available with expensive desktop software.
MATH GRAPHING provides the following functionalities:
- Multiple expressions with quasi-unlimited number of variables can be combined to produce simple or complex formulas.
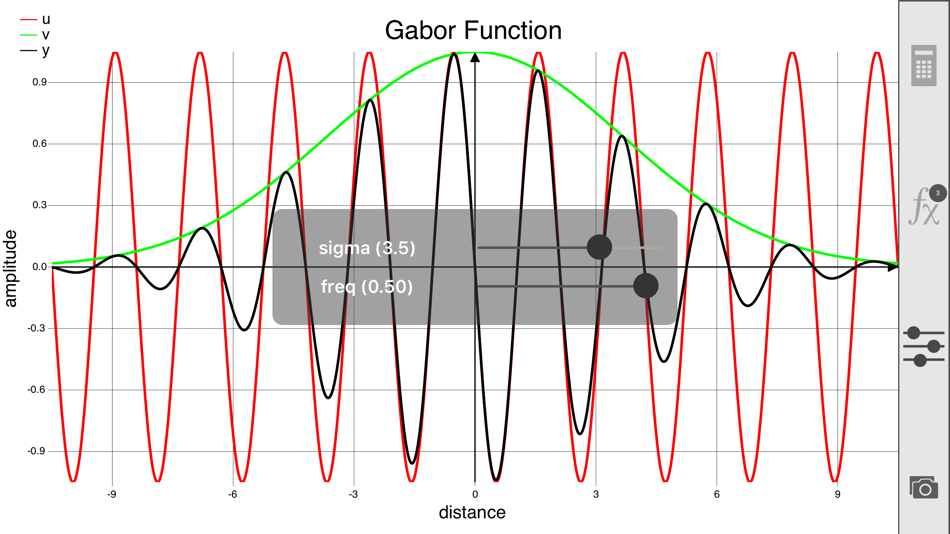
- Interactive sliders can be created to visually investigate the role of important parameters on the graphical representation of the formulas.
- Trace mode to display coordinates and derivative of marker on selected curve.
- Landscape mode for graphing.
- Solver tool to solve y = f(x) where x or y are unknown, local/global minima/maxima/extrema or intersections g(x) = f(x).
- Formula graphs can be saved to the device's Photos Album and the formulas can be exported through email with embedded graphs.
- Add any formula or calculation to your list of favorites (in-app purchase).
- Several formulas can be plotted simultaneously in different colors and styles.
- Customizable graph appearance: axes labels and ranges, title, curve color and style, ticks number, grid, legends, etc.
- A single-precision calculator supporting multiple variables.
Example of mathematical expression:
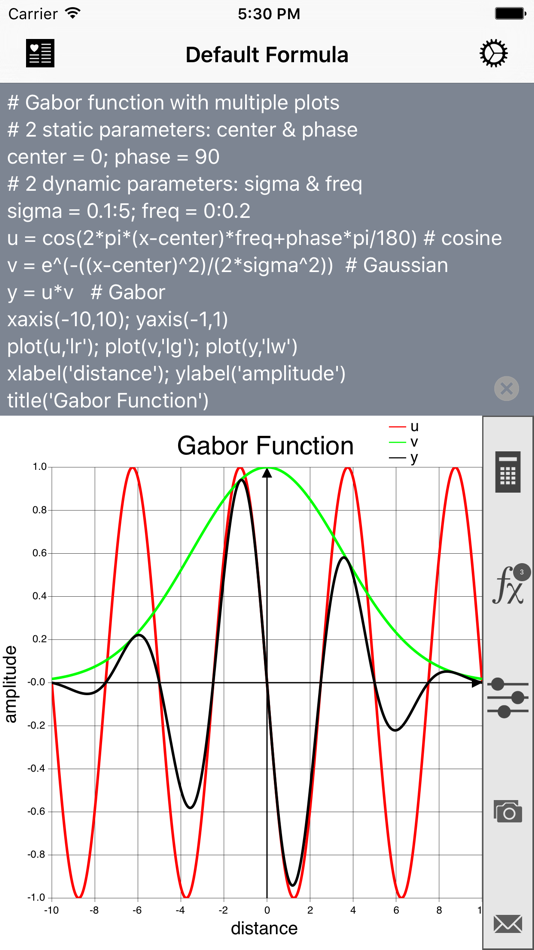
# Gabor function with multiple plots
# 2 static parameters: center & phase
center = 0; phase = 90
# 2 dynamic parameters: sigma & freq
sigma = 1:50; freq = 0:0.2
u = cos(2*pi*(x-50)*freq+phase*pi/180)
v = e^(-((x-center)^2)/(2*sigma^2))
y = u*v
plot(u,'lr'); plot(v,'lg'); plot(y,'lw')
xlabel('distance'); ylabel('amplitude')
title('Gabor Function')
Please visit our "Math Graphing" web page (http://ios.kybervision.com/mathgraphing/) to learn more about "Math Graphing"!
About KyberVision Japan LLC: we provide consulting, research and development services in Vision Sciences. We also develop vision-related applications for the iPad/iPhone/iPod Touch platform, that are spin-off products of Psykinematix, our Mac OS X flagship product in the field of Visual Psychophysics. Feel free to subscribe to our newsletter at http://iphone.kybervision.com.
Скриншоты


Что нового
- Версия: 2.0.1
- Обновлено:
- Add a title and values of dynamic variables to tabulated data copied from the solver module
Additional functions: Student's t-distribution pdf and Chi-Square Distribution cdf functions
Shake the device to reset the axes with a 1:1 aspect ratio
Minor bug fixes in interface orientation change
Цена
- Сегодня: Бесплатно
- Минимум: Бесплатно
- Максимум: Бесплатно
Отслеживайте цены
Разработчик
- KYBERVISION JAPAN LLC
- Платформы: iOS Приложения (2) macOS Приложения (1)
- Списки: 0 + 0
- Очки: 0 + 4 ¡
- Рейтинги: 0
- Отзывы: 0
- Скидки: 0
- Видео: 0
- RSS: Подписаться
Очки
Не найдено ☹️
Рейтинги
Не найдено ☹️
Списки
Не найдено ☹️
Отзывы
Ваш отзыв будет первым!
Дополнительная информация
- Категория:
iOS Приложения›Образование - Операционные системы:
Apple Watch,iPad,iPhone,iOS 7.1 и выше - Размер:
7 Mb - Поддерживаемые языки:
English - Возрастные ограничения:
4+ - App Store Рейтинг:
4.0(3) - Обновлено:
- Дата выпуска:
Контакты
Вам также могут понравиться
-
- Math Games for Kids: Learning
- iOS Приложения: Образование От: MATH GAMES FOR TODDLERS AND KIDS, MChJ
- * Бесплатно
- Списки: 0 + 0 Рейтинги: 0 Отзывы: 0
- Очки: 0 + 400 Версия: 2.4.1 Discover the world of math through fun learning games! From pre-K to 2nd grade, every child can practice essential math skills and topics: - numbers & counting - sorting - addition and
-
- HiEdu Scientific Calculator
- iOS Приложения: Образование От: Dinh Phuc
- Бесплатно
- Списки: 0 + 0 Рейтинги: 0 Отзывы: 0
- Очки: 0 + 15 Версия: 1.1.0 Welcome to the "HiEdu Scientific Calculator He-570" app - your smart, versatile, and efficient math companion! HiEdu is a scientific calculator app designed to be the perfect ...
-
- Desmos Scientific Calculator
- iOS Приложения: Образование От: Desmos
- Бесплатно
- Списки: 1 + 0 Рейтинги: 0 Отзывы: 0
- Очки: 0 + 276 Версия: 7.13.0 Move beyond arithmetic with the Desmos scientific calculator! In addition to the basic operations, take advantage of a variety of built-in functions for exploring trigonometry, ...
-
- GeoGebra Scientific Calculator
- iOS Приложения: Образование От: International GeoGebra Institute (IGI)
- Бесплатно
- Списки: 0 + 0 Рейтинги: 0 Отзывы: 0
- Очки: 0 + 22 Версия: 5.2.826 Replace your traditional calculator with this easy to use app. You may even use it in tests with our special exam mode which turns your phone or tablet into a handheld calculator. ...
-
- Math Vocabulary Cards, by MLC
- iOS Приложения: Образование От: The Math Learning Center
- Бесплатно
- Списки: 0 + 0 Рейтинги: 0 Отзывы: 0
- Очки: 0 + 3 Версия: 2.2 Math Vocabulary Cards help students deepen their conceptual understanding of key terms in mathematics. Each card features three sections: a math term, a representative example or ...
-
- Math Word Problem Drill
- iOS Приложения: Образование От: Power Math Apps LLC
- $1.99
- Списки: 0 + 0 Рейтинги: 0 Отзывы: 0
- Очки: 0 + 13 Версия: 2.0.0 Banana Math App is a fun way to practice and master fundamental math facts. The user interface is simple and clear with no distractions, allowing for kids to focus on learning. >> Some
-
- My Graphing Calculator
- iOS Приложения: Образование От: Math Inside
- $0.99
- Списки: 1 + 0 Рейтинги: 0 Отзывы: 0
- Очки: 1 + 9 Версия: 2.2 My Graphing Calculator brings at your palm the functionality of a standard scientific calculator in addition to powerful functions graphing. It supports complex numbers and complex ...
-
- The Math & Solve Problem арр
- iOS Приложения: Образование От: Math Solver
- Бесплатно
- Списки: 0 + 0 Рейтинги: 0 Отзывы: 0
- Очки: 2 + 191 Версия: 1.0.9 Introducing the ultimate Math Solver app for iOS! Whether you're a student struggling to solve complex equations or a professional looking for a handy tool to simplify your ...
-
- Toon Math: Math Game
- iOS Приложения: Образование От: Math Games
- Бесплатно
- Списки: 0 + 1 Рейтинги: 0 Отзывы: 0
- Очки: 0 + 788 Версия: 2.2.2 Do you want to play a fun game full of unique mechanics and which will help you boost your math learning fast and easy? Toon Math is here to help you enjoy a cool math experience that ...
-
- Teddy Bear Math - Doubles
- iOS Приложения: Образование От: Math ETC LLC
- Бесплатно
- Списки: 0 + 0 Рейтинги: 0 Отзывы: 0
- Очки: 0 + 3 Версия: 2.1.1 Dress the teddy bear as you cleverly practice doubling numbers. Try all 6 levels!
-
- Math Solver-Take Photo & Solve
- iOS Приложения: Образование От: HK FRIVER TECHNOLOGY LIMITED
- Бесплатно
- Списки: 0 + 0 Рейтинги: 0 Отзывы: 0
- Очки: 0 + 40 Версия: 1.1.1 -PhotoMath Take photos and import photos from Album or Files. Step-by-step solutions. (English Version) Math Keyboard, Professional Math Editor Basic math Algebra PreCalculus & ...
-
- Math for Kindergarten 2+ Years
- iOS Приложения: Образование От: Brainytrainee Ltd
- Бесплатно
- Списки: 0 + 0 Рейтинги: 0 Отзывы: 0
- Очки: 0 + 68 Версия: 1.0.1 Math games for kids are interesting learning games for toddlers which will teach your girls and boys of 3+ years old both to count objects and to add and subtract them. Play and learn ...
-
- Math In A Flash (lite)
- iOS Приложения: Образование От: Eaglet LLC
- Бесплатно
- Списки: 0 + 0 Рейтинги: 0 Отзывы: 0
- Очки: 0 + 4 Версия: 1.0.22 Math In A Flash is an app for elementary school children to practice math facts. You can select addition, subtraction, multiplication and/or division with numbers 0 - 12. It was built ...
-
- Math Worksheet Maker
- iOS Приложения: Образование От: LearnEd Apps LLC
- Бесплатно
- Списки: 0 + 0 Рейтинги: 0 Отзывы: 0
- Очки: 2 + 3 Версия: 1.2 Math Worksheet Maker is an easy-to-use math worksheet generator that is perfect for teachers, tutors, and parents! With our customization features, you won t get the same worksheet ...